How to Make Stunning Data Visualizations With D3.js
This tutorial was written using v5 of D3. To update to version 6, you can clone the repository from GitHub. See the related pull request for the changes involved.
As data becoming more and more prevalent, making them come to life with visualizations also becomes more common. It helps us understand trends and patterns that otherwise would be hard to spot.
In this tutorial, we will be looking at how to make a treemap. Inspired by Mike Bostock’s — the creator of D3.js — solution on Observable, we will go through how this can be done in the latest, fifth version of D3.js.


What is D3?
D3.js is a JavaScript library that we can use to create data visualizations with the use of HTML, CSS, and SVG. The name itself stands for Data-Driven Documents.
It’s an extremely powerful framework for creating all kinds of visualizations with smooth animations and interactivity. By the end of this tutorial, you will learn how to create the following interactive treemap:
Project Setup
Let’s jump into setting up our project. Create a new folder with an index file and import D3.
<!DOCTYPE html>
<html lang="en">
    <head>
        <meta charset="UTF-8" />
        <meta name="viewport" content="width=device-width, initial-scale=1.0" />
        <title>D3</title>
        <link rel="stylesheet" type="text/css" href="styles.css" />
    </head>
    <body>
        <svg class="treemap"></svg>

        <script src="https://d3js.org/d3.v5.js"></script>
        <script src="treemap.js"></script>
    </body>
</html>
I’ve also created a styles.css file to hold some resets as well as treemap.js that will be responsible for generating the treemap. Everything else will be handled by D3. We will populate the SVG from JavaScript.
All I have at this point in styles.css are two rules to make the SVG take up the whole screen.
Before starting to work on the treemap however, we will need a dataset to work with.

Generating Data
We will be working with a JSON file. At the end, we want to have a structure like this:
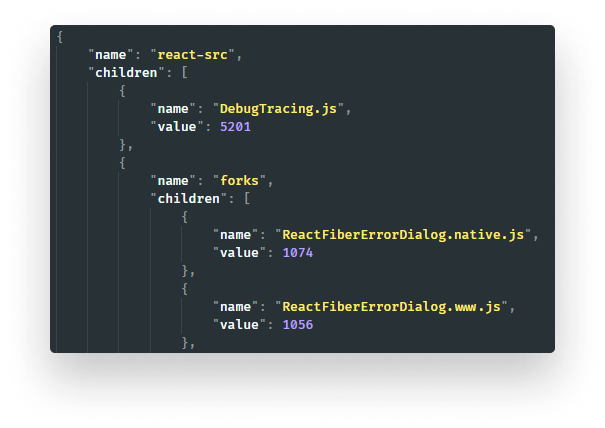
We have the root folder at the top. Each folder can have files or sub-folders. Sub-folders are denoted by a name and an array of children. If we come across a file, we also want to store its size as the value.
To generate the data, we can create a recursive function. For this, I’m using a similar implementation I’ve created in one of my previous tutorials. There I explain how recursion works. This is the function:
const getFiles = folder => {
    if (!fs.existsSync(folder)) {
        return null;
    }

    const projectTree = {
        name: folder,
        children: []
    };

    const isDirectory = fs.statSync(folder).isDirectory();

    if (isDirectory) {
        const files = fs.readdirSync(folder);

        files.forEach(file => {
            const isSubDirectory = fs.statSync(`${folder}/${file}`).isDirectory();

            if (isSubDirectory) {
                const child = getFiles(`${folder}/${file}`);

                child.name = file;

                projectTree.children.push(child);
            } else {
                projectTree.children.push({
                    name: file,
                    value: fs.statSync(`${folder}/${file}`).size
                });
            }
        });
    } else {
        projectTree.children.push({
            name: folder,
            value: fs.statSync(folder).size
        });
    }

    return projectTree;
};Let’s have a brief look at how it works.
Understanding the data generation function
We can generate an object by calling the function with a folder of choice. Since it returns a JavaScript object, we will have to call JSON.stringify on it. Let’s break down how it works:
- Line:2: We start with some checks. If the folder doesn’t exist, we return with
null. - Line:6: We define the root object. It has a name and some children.
- Line:13: If we are dealing with a directory, we want to loop through each file, starting from line:16.
- Line:19: If one of the files is a sub-directory, we want to call this function with a new path. The output value of this will be a
childnode. - Line:25: If we are dealing with a file, we can simply append it to
childrenwith its name and size. - Line:32: The same steps can be done if we are at the root and the parameter we passed in is a file.
You can run this function on the same folder I’m using, to get the same results. I’m using one of React’s packages. Don’t forget to wrap it in JSON.stringify. Save the output as data.json as we will use it later.
// Run it with node fileTree.js
console.log('filetree:', JSON.stringify(getFiles('src')));Making The Treemap Setup
Now that we have everything set up, let’s jump into treemap.js. First, start off with defining some configuration variables.
Defining configurations
Add the following to your treemap.js.
const width = window.innerWidth;
const height = window.innerHeight;

const filePath = 'data.json';

let data;
let color = d3.scaleSequential([8, 0], d3.interpolateCool);We want to show the treemap in full-screen, so we are going with the window’s dimensions for width and height. We also want to define the path for the data at the beginning so we can easily change it later.
Lastly, I’ve created two other variables, one that will hold the JSON data once we read the file. And another one for the color scheme. This will return a new function we can call with different numbers. For each number, it will return a different color.
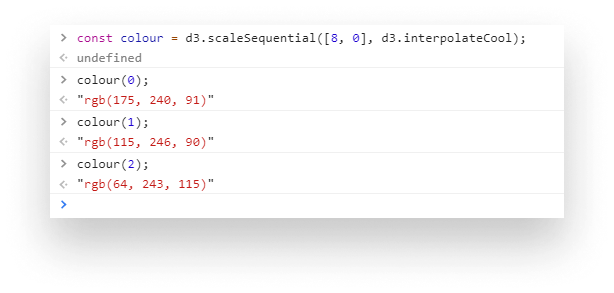
We will use the depth of the tree to create various colors for different levels.
Creating the treemap function
First, we need a function that will create a treemap for us based on the passed data. We can use the built-in d3.treemap function for this. Add the following to your treemap.js.
const treemap = data => d3.treemap()
                          .size([width, height])
                          .paddingOuter(5)
                          .paddingTop(20)
                          .paddingInner(1)
                          .round(true)
                          (d3.hierarchy(data)
                          .sum(d => d.value)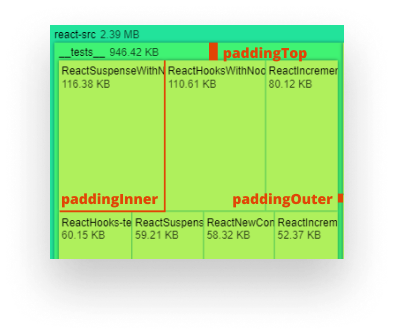
.sort((a, b) => b.value - a.value));Let’s examine what this function does. We call d3.treemap and set some parameters:
- We make it fullscreen
- Set some paddings to make the rectangles nicely separated
- Enable rounding for the width and height of the rectangles
- Then we call the treemap function with
d3.hierarchy, passing our JSON data. This will decorate our dataset with extra properties such asdepthorparent. We then need to sum and sort the dataset so we have the largest element on top.
Getting data from the JSON
The next step is to get the JSON data. For this we can use d3.json.
(async () => {
    data = await d3.json(filePath).then(data => data);
    render(data);
})();Since this function uses the Fetch API internally, we will need to use a web server. For this purpose, I’m using the http-server module, which is a perfect solution for serving static assets. You can get it installed globally by running npm i http-server -g.
After that, we can pass the data into a render function that will draw everything into the screen. So let’s create that now.
Making Treemaps
First, we want to define the root of the treemap and get the SVG from the DOM. This is where we will place everything.
const render = data => {
    const root = treemap(data);
    const svg  = d3.select('.treemap')
                   .attr('viewBox', [0, 0, width, height]);
};This can be done with d3.select. It works just like a jQuery selector. We can also manipulate attributes with the attr method. Since each d3 call returns the same object, we can chain calls one after the other. We want to make our SVG take up the full screen. This is why we set the viewBox to the width and height of the screen.
Also the root will now have information on the position and dimension of each node, so we know where to place them.
Creating SVG groups
Now we need to make the nodes for the groups which will hold the rectangles and their title. Add the following to the render function.
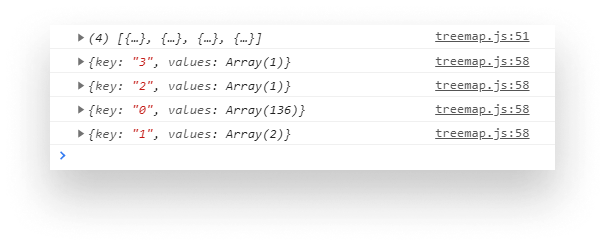
const node = svg.selectAll('g')
                .data(d3.nest().key(d => d.height).entries(root.descendants()))
                .join('g')
                .selectAll('g')
                .data(d => d.values)
                .join('g')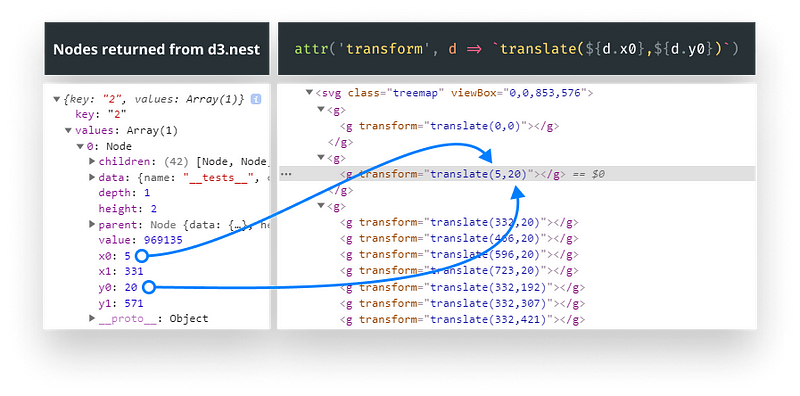
.attr('transform', d => `translate(${d.x0},${d.y0})`);For the first sight, this may seem intimidating but let’s see what each of the functions does. First, we select the SVG and select all group elements inside it. Since we don’t have any, D3 will create this for us based on the length of the data we pass in.
The second data function is used for data binding. It expects an array. For each layer, we want to create a separate group. From the descendants of our treemap, d3.nest.key.entries will calculate how many depths we have. Based on the height property of the datum that is passed to key.
We then need to call join to update the elements to match the data that was previously bound by data.
Then we want to bind data once more. In order to do that, we have to call selectAll again. But this time, we will use the values returned by the previous data bind. This is so that for each array element, we create a new group item inside each top group. After that, we need to call join once more to update the elements.
So now we have the data available to add a transform to each element. This is used for positioning the rectangles inside the map.
Creating rectangles
Now let’s get something showing on the screen. We first want to create the rectangles. Add the following after the node variable.
node.append('rect')
.attr('fill', d => color(d.height))
.attr('width', d => d.x1 - d.x0)
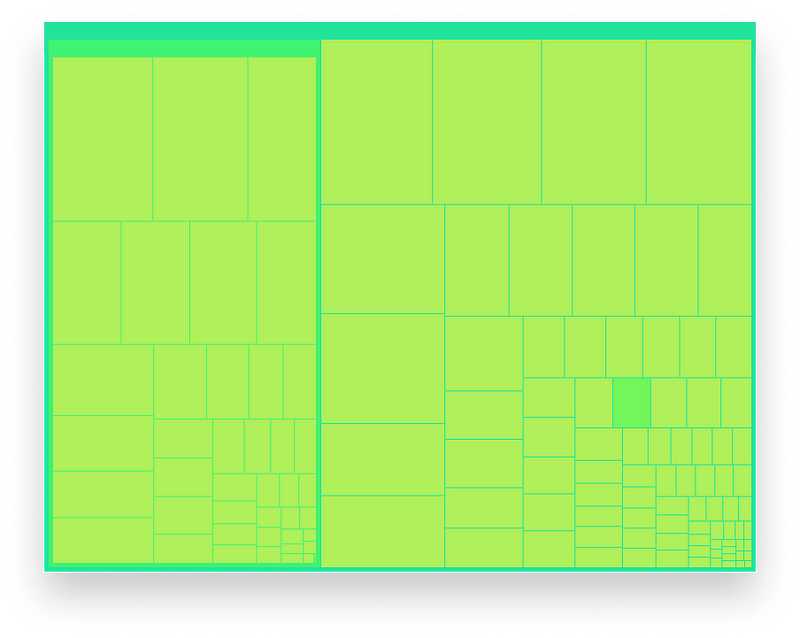
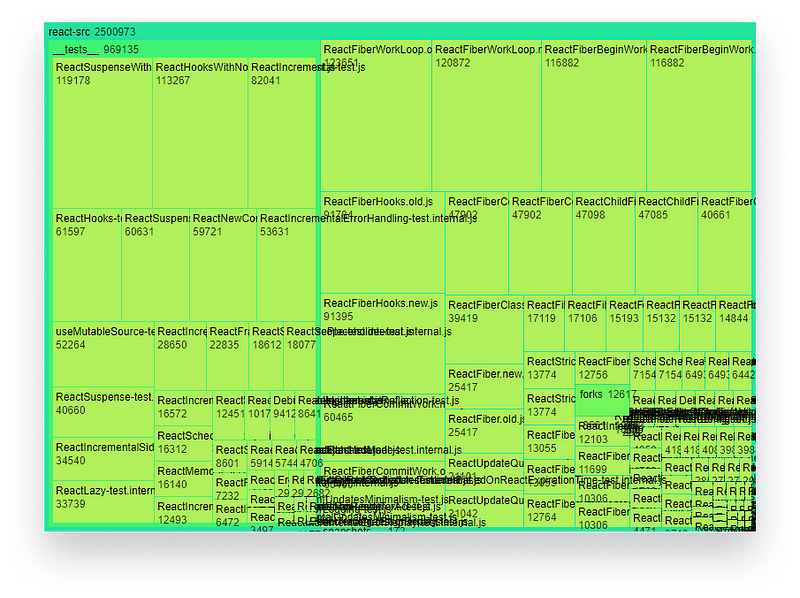
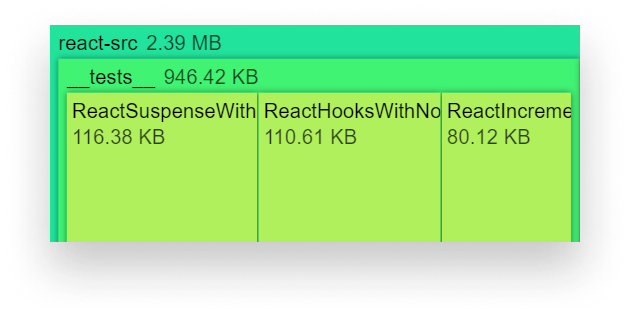
.attr('height', d => d.y1 - d.y0);In each attr call, d represents datum, that is the properties of each element. For every node, we append a rectangle and choose the fill color based on its height property. This is where we use the color function which we defined. We can also calculate the width and height based on the starting and ending points. Now you should have some empty rectangles drawn on the screen:
Adding labels
Let’s add labels as a next step. Add the following lines after the rectangles.
node.append('text')
    .selectAll('tspan')
    .data(d => [d.data.name, d.value])
    .join('tspan')
    .attr('fill-opacity', (d, i, nodes) => i === nodes.length - 1 ? 0.75 : null)
.text(d => d);Here we use the selectAll-data-join chain again. This will create two tspan elements inside the text node. One with the name and one with the value. On line:5, we also set the opacity of the value to 75%. As you can see, the callback functions can accept three arguments:
- one for the datum, holding information about the node. Since we bound
d.data.nameandd.valuepreviously, it will only hold those values. - one for the index in the loop
- one for the nodes which hold references to the DOM nodes
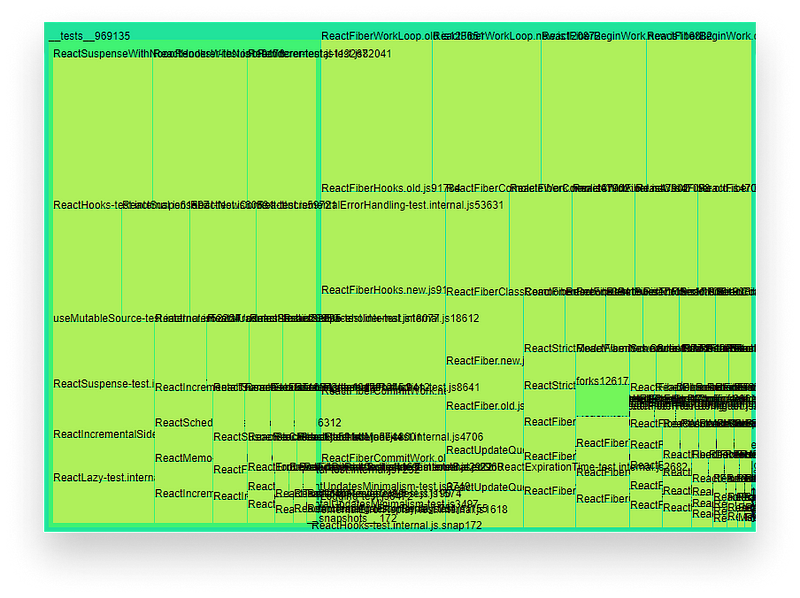
So if the loop is at the very last element, which holds d.value, we reduce the opacity. Otherwise, we can leave it as is. If you refresh the page, we will now have some titles. But they are position pretty badly. Let’s fix it.
Positioning labels
We want to position the parents and children separately. To do that, add two new blocks to treemap.js.
// Set position for parents
node.filter(d => d.children)
    .selectAll('tspan')
    .attr('dx', 5)
    .attr('y', 15);

// Set position for everything else that doesn't have children
node.filter(d => !d.children)
    .selectAll('tspan')
    .attr('x', 3)
.attr('y', (d, i, nodes) => i === nodes.length - 1 ? 30 : 15);This can be done by using filters. For the first block, anything that has children will be selected. The opposite is true for the second block. For the parents, we want the name and value to be on the same line. For the children, we want them on separate lines. We can follow the same logic we used for fill-opacity to correctly position both tspan elements.
It starting to come together, but we have one more problem. The texts are overflowing.
Fixing overflow
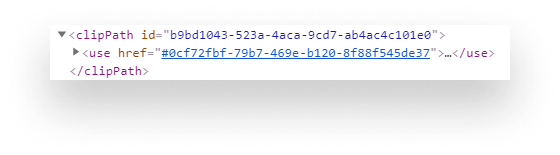
To fix this, we want to add a clipPath element, with the same dimensions as the rectangles. In SVG, this can be done using the use tag with a reference to the id of the rectangle.
Since we have quite a few elements on the page, we need to somehow generate unique ids. For this, I’ve turned to StackOverflow to find out what is the best approach. This is the function that I ended up using:
const uuidv4 = () => {
    return 'xxxxxxxx-xxxx-4xxx-yxxx-xxxxxxxxxxxx'.replace(/[xy]/g, c => {
        const r = Math.random() * 16 | 0;
        const v = c == 'x' ? r : (r & 0x3 | 0x8);

        return v.toString(16);
    });
};First, let’s extend the rectangles with an id attribute.
node.append('rect')
    .attr('id', d => d.nodeId = uuidv4())
...We can also add additional properties to datum. Later we’re going to reuse nodeId in the clipPath element. So let’s add that next. Add it just after we defined the rectangles.
// Create clip path for text
node.append('clipPath')
    .attr('id', d => d.clipId = uuidv4())
    .append('use')
.attr('href', d => `#${d.nodeId}`);We also want to set an id for the clip-path. This is so that we can reference it in the text. For the href we can use the previously set nodeId. Lastly, we need to reference this clip-path in our text element.
node.append('text')
    .attr('clip-path', d => `url(#${d.clipId})`)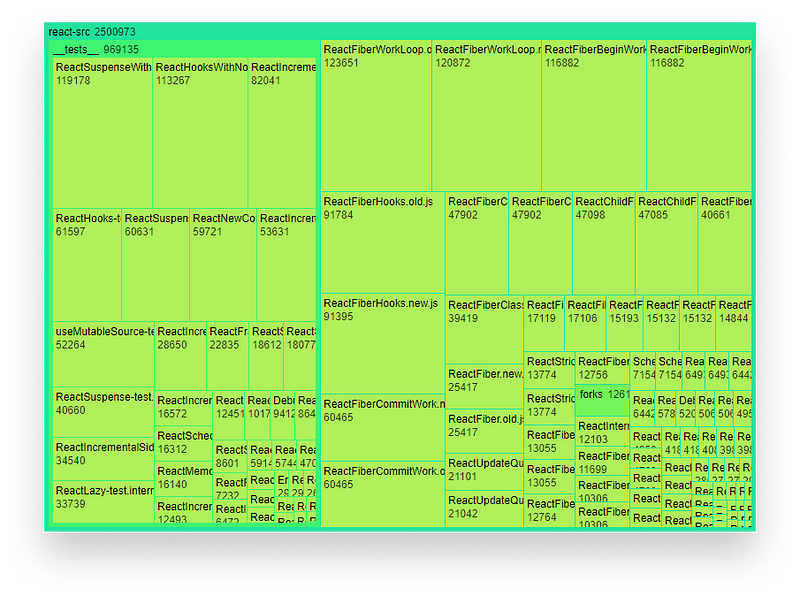
...If we did everything correctly, we should now have a pretty solid foundation.
Formatting values
We can add one more thing to make the labels prettier. The values are currently in bytes. This doesn’t mean too much for the average person, so let’s convert them to more readable formats. Once more, I’ve turned to StackOverflow to find out how we can convert bytes to KB and MB. This is the function we want to use:
const formatBytes = (bytes, decimals = 2) => {
    if (bytes === 0) return '0 Bytes';

    const k = 1024;
    const dm = decimals < 0 ? 0 : decimals;
    const sizes = ['Bytes', 'KB', 'MB', 'GB', 'TB', 'PB', 'EB', 'ZB', 'YB'];

    const i = Math.floor(Math.log(bytes) / Math.log(k));

    return parseFloat((bytes / Math.pow(k, i)).toFixed(dm)) + ' ' + sizes[i];
};To format the values, all we have to do is wrap d.value into this function, where we add the texts.
node.append('text')
        .attr('clip-path', d => `url(#${d.clipId})`)
        .selectAll('tspan')
         // Wrap d.value into the formatBytes function
        .data(d => [d.data.name, formatBytes(d.value)])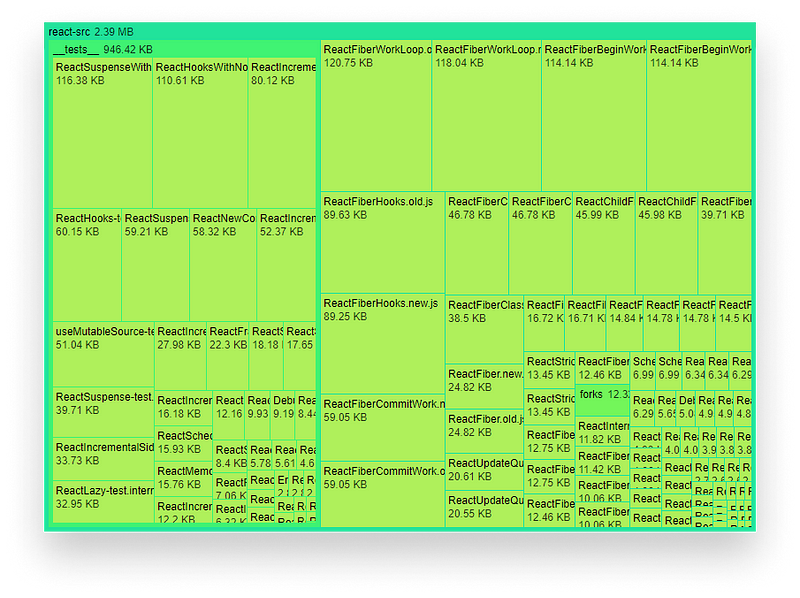
...And now this looks way better.
Adding titles
To improve accessibility, let’s also add titles to the rectangles. We preferably want to see the whole path, like in the image below.
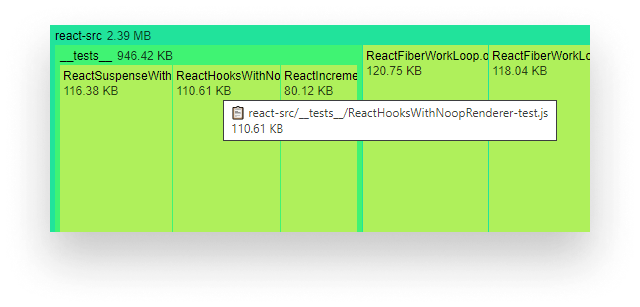
To do this, append the following to treemap.js:
node.append('title')
    .text(d => {
        const path = getPath(d, '/');
        const icon = path.includes('.') ? '📋' : '📂️';

        return `${icon} ${getPath(d, '/')}\n${formatBytes(d.value)}`;
});Based on the return value of getPath— which we haven’t defined yet — we want to show a file or folder icon. This is followed by the full path of the file. On a new line, we can also show the size. The getPath function can be done in a single line.
const getPath = (element, separator) => element.ancestors().reverse().map(elem => elem.data.name).join(separator)It expects an element and a separator. With element.ancestors, we can get every parent. To start with the root first, we also need to call reverse. As we are only interested in their name, we can call a map and join the strings together with the passed separator.
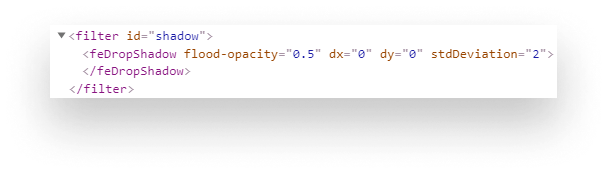
Adding shadows
Lastly, to make the depth of each level more prominent, let’s add some shadows. For this, we will need to create a new filter on the SVG. At the beginning of the render function, add the following:
// Create shadow
svg.append('filter')
   .attr('id', 'shadow')
   .append('feDropShadow')
   .attr('flood-opacity', 0.5)
   .attr('dx', 0)
   .attr('dy', 0)
.attr('stdDeviation', 2);On its own, this won’t do much, but now we have a filter element with an id of shadow that we can reference for our nodes.
To use it, all we need to do is add a filter attribute for the group elements.
const node = svg.selectAll('g')
                .data(d3.nest().key(d => d.height).entries(root.descendants()))
                .join('g')
                // Adding filters for each <g>
                .attr('filter', 'url(#shadow)')
...Now we should have some nice drop shadows showing.
Making The Map Interactive
As a very last touch, let’s make the whole thing interactive. First, let’s start by creating a theme switcher so we can choose from different color schemes. Then we can also implement a zooming functionality so the treemap will be navigable.
Theme switcher
For this, we’re going to need a dropdown menu. Add the following to your index.html file.
<div class="options">
  <select>
      <option value="interpolateCool" selected="selected">interpolateCool</option>
      <option value="interpolateCividis">interpolateCividis</option>
      <option value="interpolateCubehelixDefault">interpolateCubehelixDefault</option>
      <option value="interpolateInferno">interpolateInferno</option>
      <option value="interpolateMagma">interpolateMagma</option>
      <option value="interpolatePlasma">interpolatePlasma</option>
      <option value="interpolateRainbow">interpolateRainbow</option>
      <option value="interpolateSinebow">interpolateSinebow</option>
      <option value="interpolateSpectral">interpolateSpectral</option>
      <option value="interpolateViridis">interpolateViridis</option>
      <option value="interpolateWarm">interpolateWarm</option>
  </select>
</div>We can also add some absolute positioning in CSS to make it always show in the top right corner. To make it work, we need to add an on-change listener for the select.
d3.select('select').on('change', function () {
    color = d3.scaleSequential([8, 0], d3[d3.select(this).property('value')]);

    node.select('rect').attr('fill', d => color(d.height));
});In the callback function, we simply need to redefine the color variable, that we’ve added as a configuration in the beginning. Then we get the value from the select and pass it to scaleSequential. For example, if we select the fourth option, we get d3['interpolateInferno'] back, which returns an interpolator.
Then we simply have to reassign the fill attribute to the rectangles with the new color.
Adding Zooming Functionality
Now there are some nodes that are so small we don’t see any sub-folders in it. Just like the “forks” folder in the GIF above. Ideally, we want to zoom into them. So let’s add that now.
For this to work, we will need to re-render the treemap with a new root. In this example, the root will be the “forks” folder.
node.filter(d => d.children && d !== root)
    .attr('cursor', 'pointer')
.on('click', d => zoom(d.path, data));Start with a filter. We only want to add a click event to those that have children. We also don’t want to have a click listener on the root. To suggest to the user that this element can be interacted with, let’s also change the mouse to a pointer.
This will call a zoom function with a path and the JSON data. Since we don’t have a path property on the datum, let’s add it as well. Inside the title where we appended the text, add this new line:
node.append('title')
    .text(d => {
        const path = getPath(d, '/');
        const icon = path.includes('.') ? '📋' : '📂️';

        d.path = getPath(d, '.');

        return `${icon} ${getPath(d, '/')}\n${formatBytes(d.value)}`;
});Creating the zoom function
For the zoom function, we want to call render with a new root.
const zoom = (path, root) => {
    const name = path.split('.').splice(-1)[0];
    const treemapData = '???';

    render({
        name,
        children: treemapData
    });
}The name of the root will be the last element inside the path. Staying at the example, in case of react-src.forks, it will be “forks”. To get the treemapData we can use a reducer to loop through the JSON and get the portion we are interested in.
const normalizedPath = path.split('.')
                           .slice(1)
                           .join('.');

const treemapData = normalizedPath.split('.').reduce((obj, path) => {
    let returnObject;

    obj.forEach(node => {
        if (node.name === path) {
            returnObject = node.children;
        }
    });

    return returnObject;
}, root.children);Since we always start from the root, we can get rid of the first part of the path. For react-src.forks this leaves us with only forks. This will be the value of normalizedPath. Inside the reducer, we then use a forEach to loop through the children, and if the name matches, we return that object. If we try this out, we will get an error however.
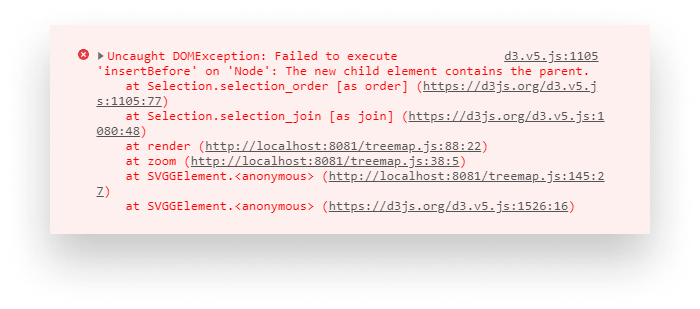
This is because, at the very beginning of the render function, we need to get rid of everything inside the SVG. Otherwise, we would try to add the same things for an already populated SVG.
d3.select('.treemap').selectAll('*').remove();
But we don’t have a way to zoom out. To fix this, add a button to your index file and a new click listener just after we render the initial data.
(async () => {
    data = await d3.json(filePath).then(data => data);

    render(data);

    d3.select('button').on('click', () => render(data));
})();This ensures we are able to reset the view and go back to the original root.
And you have just created your very first treemap! 🎉
Wrapping Things Up
I hope the amount of steps needed to finish this project wasn’t too overwhelming. To wrap everything up, I would like to provide you some documentation that can help you dig deeper into the world of D3.js. While the official D3 documentation is quite large, it can be hard to see how things fit together. This is why I recommend to rather look through the examples on Observable.
Also, the whole project is hosted on GitHub, so you can clone it if you want to experiment with the finished piece. Thank you for taking the time to read this article. Happy coding!

Rocket Launch Your Career
Speed up your learning progress with our mentorship program. Join as a mentee to unlock the full potential of Webtips and get a personalized learning experience by experts to master the following frontend technologies:
Courses


Recommended
How to Create Native Drag and Drop Functionality in JavaScript

How to Make Your Very First Desktop App With Electron and Svelte