Core Web Vitals: What Are They and Why You Need to Know About Them?
Optimizing the user experience on the web is an essential part of any online business that wants to achieve long-term success. And when it comes to optimizing user experience, you usually also hear about performance optimization. The two go hand in hand.
Web vitals is an initiative by Google that aims to help you make the user experience quantifiable, by introducing performance metrics. These metrics can show the overall performance of your site that impacts user experience.
Among these metrics — called web vitals —, the ones that matter the most are called core web vitals. These are key performance metrics that impact user experience the most. There are three metrics that make up core web vitals, focusing on three aspects of the user experience (loading, interactivity, visual stability). Each of them can give you valuable insights on what to improve to enhance your UX. Let’s see them one by one.
Loading
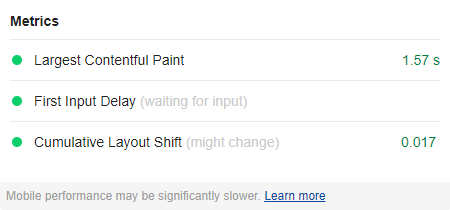
The first metric is related to loading and is called “Largest Contentful Paint” or LCP for short. It measures the time when the main content of your website is fully rendered, meaning your users have something meaningful to look at. So when is LCP considered good? If it happens within 2.5 seconds — measured from when the page first starts loading — it is considered good.
What are the main causes of poor load times?
There are several factors that can affect poor performance.
Slow server response times
One of the main causes of poor LCP is slow servers. This can be anything from unoptimized API infrastructure that takes a long time to request data from your database, to even smaller things, like wrong server configurations, such as disabled compression.
Slow resources
Slow resources are another big problem. Things such as unoptimized images and JavaScript bundles can slow the time it takes for your client to download everything.
Common elements that can highly affect LPC are img or video tags, that are requesting large resources. You can also count here elements that have a background image set through CSS.
It’s also important to mention that images account for most bytes downloaded for the majority of websites. Therefore, it is critical to always optimize them as best as you can. Image optimization deserves a whole topic on its own. If you are interested, have a look at my tutorial about content optimization.
Render blocking assets
Render blocking elements can be another common cause of poor LCP. These elements block the browser from rendering anything to your users as long as these resources are not fetched. Therefore, non-critical resources should be deferred.
How can you tackle slow network response?
So how can you make sure, you have the best LCP score you can get?
First off, start by optimizing your code, infrastructure, and configuration at your server-side. Make sure you have either GZIP or Brotli compression enabled. Try to identify which requests are taking the most time for your browser to make. Is it because of large resource sizes, or is your API takes extra time to respond to certain requests?
Also, try to cut down the number of times your client needs to communicate with your server. Make sure every request counts and is indeed needed. Bundle your resources and minify them. Try to reduce their size as much as you can. Lazy load offscreen images and any other resource that is not needed for the initial page load.
Interactivity
The second core web vital is called “First Input Delay” or FID for short, and it measures the time it takes for the first input to be processed. Anything below 100ms is considered good, and anything above 300ms can be considered poor performance.
What can delay interactivity?
Most commonly, input delays are caused by long-running JavaScript tasks, but we can also count here render-blocking elements or slow resource load times.
Remember that interaction can also happen when a user simply clicks on a link. It doesn’t necessarily have to do anything with JavaScript. But for feature-heavy websites that implement tons of custom functionality, JavaScript is usually the culprit.
What can you do about input delays?
The greatest you can gain is from eliminating long-running JavaScript tasks. We will have a look at the end of the article, how to identify these through the DevTools’ performance tab.
Another thing you can do is trying to eliminate render-blocking elements and try to cut down on your slow resource load times, by optimizing both server and the client-side.

Visual Stability
Lastly, we have “Cumulative Layout Shift” or CLS for short. It measures layout shifts on your page that cause elements to unexpectedly change positions. A good CLS score is less than 0.1. It can cause real harm to users when they take actions, they don’t intend to.

What can cause visual instability?
Visual instability can be caused by a number of different things. Most commonly, it is caused by one of the following four points:
Images with no dimensions
When you don’t specify the dimensions for an image beforehand, it causes content to jump around when it’s finally loaded.
Dynamically rendered content
This can also happen with dynamically inserted content, such as inserting gists on this page, which takes some time to fetch.
Web fonts causing FOIT or FOUT
Most websites use custom font families for their brands. Loading them takes some time just as for images, which can cause a flash of invisible text (FOIT), or a flash of unstyled text (FOUT).
Bad state management
We can also count this as “Dynamically rendered content”, but I wanted to mention it separately. Most web applications nowadays are built by React, Angular, or Vue, and are rendered on the client-side. If your state is not managed correctly in your frontend application, it can easily cause layout shifts.
Imagine you display all static data, but you have content that depends on a database. If you render everything out, except the dynamic content, it will also cause layout shifts.

What is the cure to poor CLS?
So what is the cure to all this madness? Let’s go in order to see a solution to each of them.
How to load images
To avoid content shift for images, make sure you always define their width and height. This ensures that space is reserved for them, so they won’t make content jump around.

You can further enhance this solution, by either using a placeholder image to let users know they should expect an image to appear soon, or you can also use a predominant color from the image.
Another common technique is using a low-resolution blurred version of the image, which is then replaced with the final version.

You can also make use of the srcset attribute on img tags to make sure you only request the absolute necessary bytes for each device. For example, you don’t want to fetch your highest resolution image for mobile devices.
How to approach content injection
A good rule of thumb is to never inject content above already existing content. Of course, this can’t be always achieved. As you’ve seen with the example of gists, it would make no sense to display them all under the post. They need to be rendered between the paragraphs.
In cases like this, you can approach it the same way you do for images. Reserve some space for them. Of course, it’s hard to tell what will be the end height of dynamic content, but by assigning the minimal possible height to them, you can further reduce content shifts by a bit.
If your site uses ads, you most probably already know their sizes before they are requested and rendered, as most of them use a fixed size. In their case, you can confidently reserve space for them by setting their width and height attributes.
<!-- Width and height property present on image to reserve space -->
<img src="hero.jpg" alt="👨" class="hero-img" width="900" height="600" />

<!-- Use srcset with sizes to display different images based on screen size -->
<img srcset="small-nickcage.jpg 320w,
             medium-nickcage.jpg 768w,
             large-nickcage.jpg 1024w"
     sizes="(max-width: 320px) 280px,
            (max-width: 768px) 720px,
            1024px"
     src="large-nickcage.jpg"
alt="No need for introduction, you already know him" />How You Can Measure Web Vitals?
Of course, if you can’t measure them, you’ll hardly be able to make optimizations. Let’s see what are your options when it comes to addressing web vital problems.
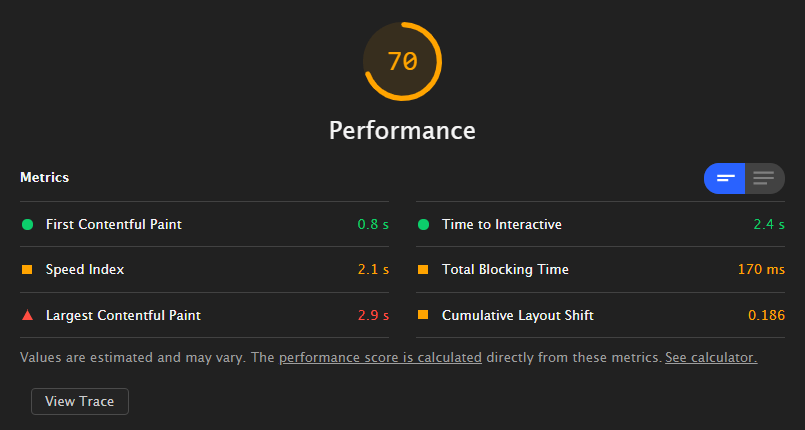
Lighthouse
If you’ve guessed Lighthouse will be on this list, you were right. This is where you should start out auditing your page. It can generate detailed reports for both desktop and mobile, which includes all three core web vital metrics, with the reasoning behind the score. You’ll also get a list of resources that can help you addressed issues to fix your scores.
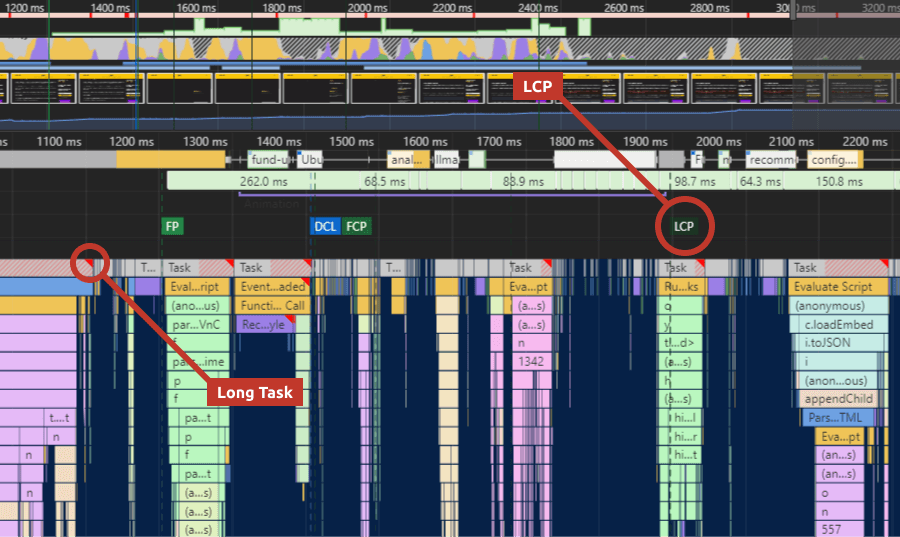
DevTool’s performance tab
Another great place to start collecting insights to address problems is DevTool’s performance tab. It shows you layout shifts in the “experience” row, as well as what causes LCP, inside the “timings” row. You also have the ability to identify long-running JavaScript tasks, which is usually the main cause of poor FID.
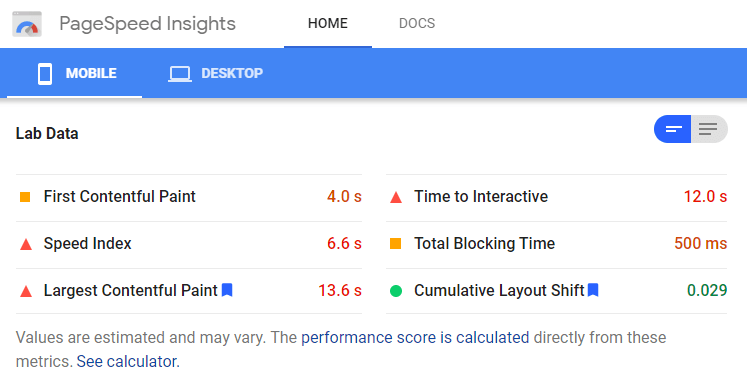
Google’s PageSpeed Insight Tool
If you are not using Chrome, you still have the ability to use Lighthouse through Google’s PageSpeed Insight Tool. It works the same way, and you get results generated for core web vitals.
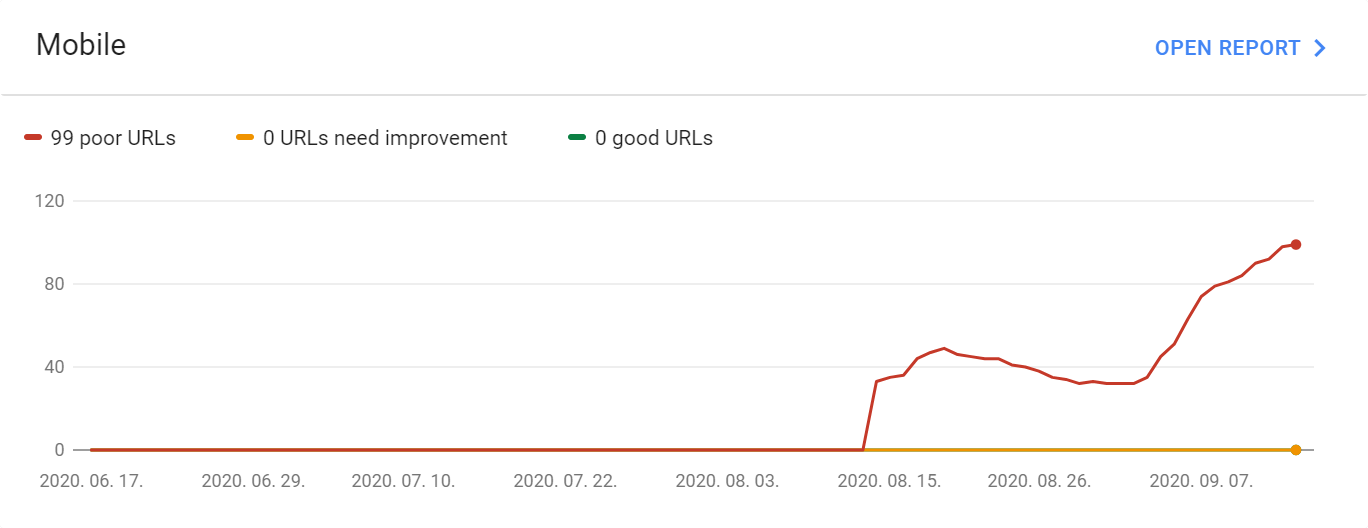
Search Console
You can also find valuable information on Google’s Search Console, inside the “Core Web Vitals” tab on the left-hand side, under “Enhancements”. This shows you which sites on your page need your attention, because of poor performance.
Chrome extension
Lastly, there’s also a Chrome extension created for core web vitals, that has the ability to quickly check your page for these three metrics.
Summary
By addressing core web vital metrics, you ensure that user experience is top-notch on your site. This not only helps in terms of performance but also has an SEO impact. Therefore — indirectly — they can have an impact on your business and your conversion rates.
Do you already have some experience with core web vitals? Let us know your thoughts in the comments! Thank you for reading through, happy optimization! 📈
If you would like to know more about website optimization, have a look at what are some critical points you must pay attention to.

Rocket Launch Your Career
Speed up your learning progress with our mentorship program. Join as a mentee to unlock the full potential of Webtips and get a personalized learning experience by experts to master the following frontend technologies:
Courses


Recommended

How to Create an Autocomplete Search Component in React
How to Master Using Flexbox in CSS